
Inventory Nightmare? How to Prevent Stockouts and Overstocking
The inventory crisis is not a simple case of “too much” or “too little” it is a complex, two-sided problem costing modern businesses millions in lost sales, wasted capital, and carrying costs. In today’s volatile supply chain landscape, achieving inventory optimization the perfect balance between supply and demand is no longer optional; it is the cornerstone of profitability and customer satisfaction.
This advanced guide moves beyond basic reorder alerts to explore the strategic frameworks, mathematical models, and predictive analytics required to master your stock levels and permanently eliminate the dreaded inventory imbalance.
The Dual Crisis: Understanding the True Cost of Imbalance
The inventory nightmare is defined by two opposing forces that erode your profit margins. To prevent stockouts and overstocking, you must first quantify the severe, often hidden, costs of each.
1. The Catastrophic Cost of Stockouts (Understocking)
A stockout (or out-of-stock situation) is an immediate profit killer, but its effects extend far beyond the single lost sale.
| Cost Element | Description | Long-term Impact |
|---|---|---|
| Direct Lost Sale | Immediate revenue loss from an inability to fulfill an order. | Lowers quarterly revenue targets. |
| Customer Defection | The customer goes to a competitor and may never return. | Damages customer lifetime value (CLV) and brand loyalty. |
| Expedited Shipping | High rush order fees to rectify the situation after the stockout. | Increases landed cost and reduces gross margin. |
| Production Downtime | If a component stockout stops the manufacturing line (common in B2B). | Massive operational waste and schedule delays. |
Key Takeaway: Stockouts primarily destroy long-term brand equity and customer relationships.
2. The Hidden Drain of Overstocking (Excess Inventory)
Overstocking ties up working capital and creates immense organizational drag. While it prevents stockouts, the high inventory carrying costs often outweigh the benefit.
| Cost Element | Description | Long-term Impact |
|---|---|---|
| Capital Tie-up | Money spent on inventory that sits idle, unable to be reinvested. | Inhibits growth and cash flow. |
| Obsolescence Risk | Inventory becomes outdated (especially in tech, fashion, or consumables). | Leads to painful write-downs and asset devaluation. |
| Warehousing Costs | Storage, insurance, utilities, and labor costs associated with holding excess SKUs. | Inflates overhead and reduces net profit margin. |
| Shrinkage & Damage | Higher chances of loss, damage, or theft over extended holding periods. | Directly impacts the balance sheet’s assets. |
Key Takeaway: Overstocking is a silent killer of cash flow and efficiency. Focus on “Optimizing inventory carrying costs.”
Foundation 1: Precision Demand Forecasting (The Root Cause Fix)
The single biggest driver of both inventory extremes is poor demand forecasting. Advanced inventory management requires moving beyond simple moving averages to incorporate sophisticated statistical and machine learning models.
Integrating External & Internal Data Sources
To achieve true forecasting accuracy, your predictive analytics system must ingest data far beyond historical sales figures:
- Internal Data: Historical sales, promotional calendars, return rates, stock transfer requests, and website traffic/conversion data.
- External Data: Seasonality (holidays, weather), competitive pricing, geopolitical supply chain risk signals, and macroeconomic indicators (e.g., inflation affecting consumer spending).
Leveraging Time-Series Models
For stable products, time-series models provide reliable forecasts. Exponential Smoothing (ETS) and ARIMA (Autoregressive Integrated Moving Average) models are fundamental for analyzing trends and cycles in historical demand patterns.
For more intermittent or highly variable demand (common in B2B spares), use advanced methods like Croston’s Method or Tsay’s Method to separate zero-demand periods from actual order size, improving your SKU forecasting accuracy.
Foundation 2: Mastering Inventory Optimization Variables
True inventory control is achieved by mathematically optimizing the core variables that govern your reordering process.
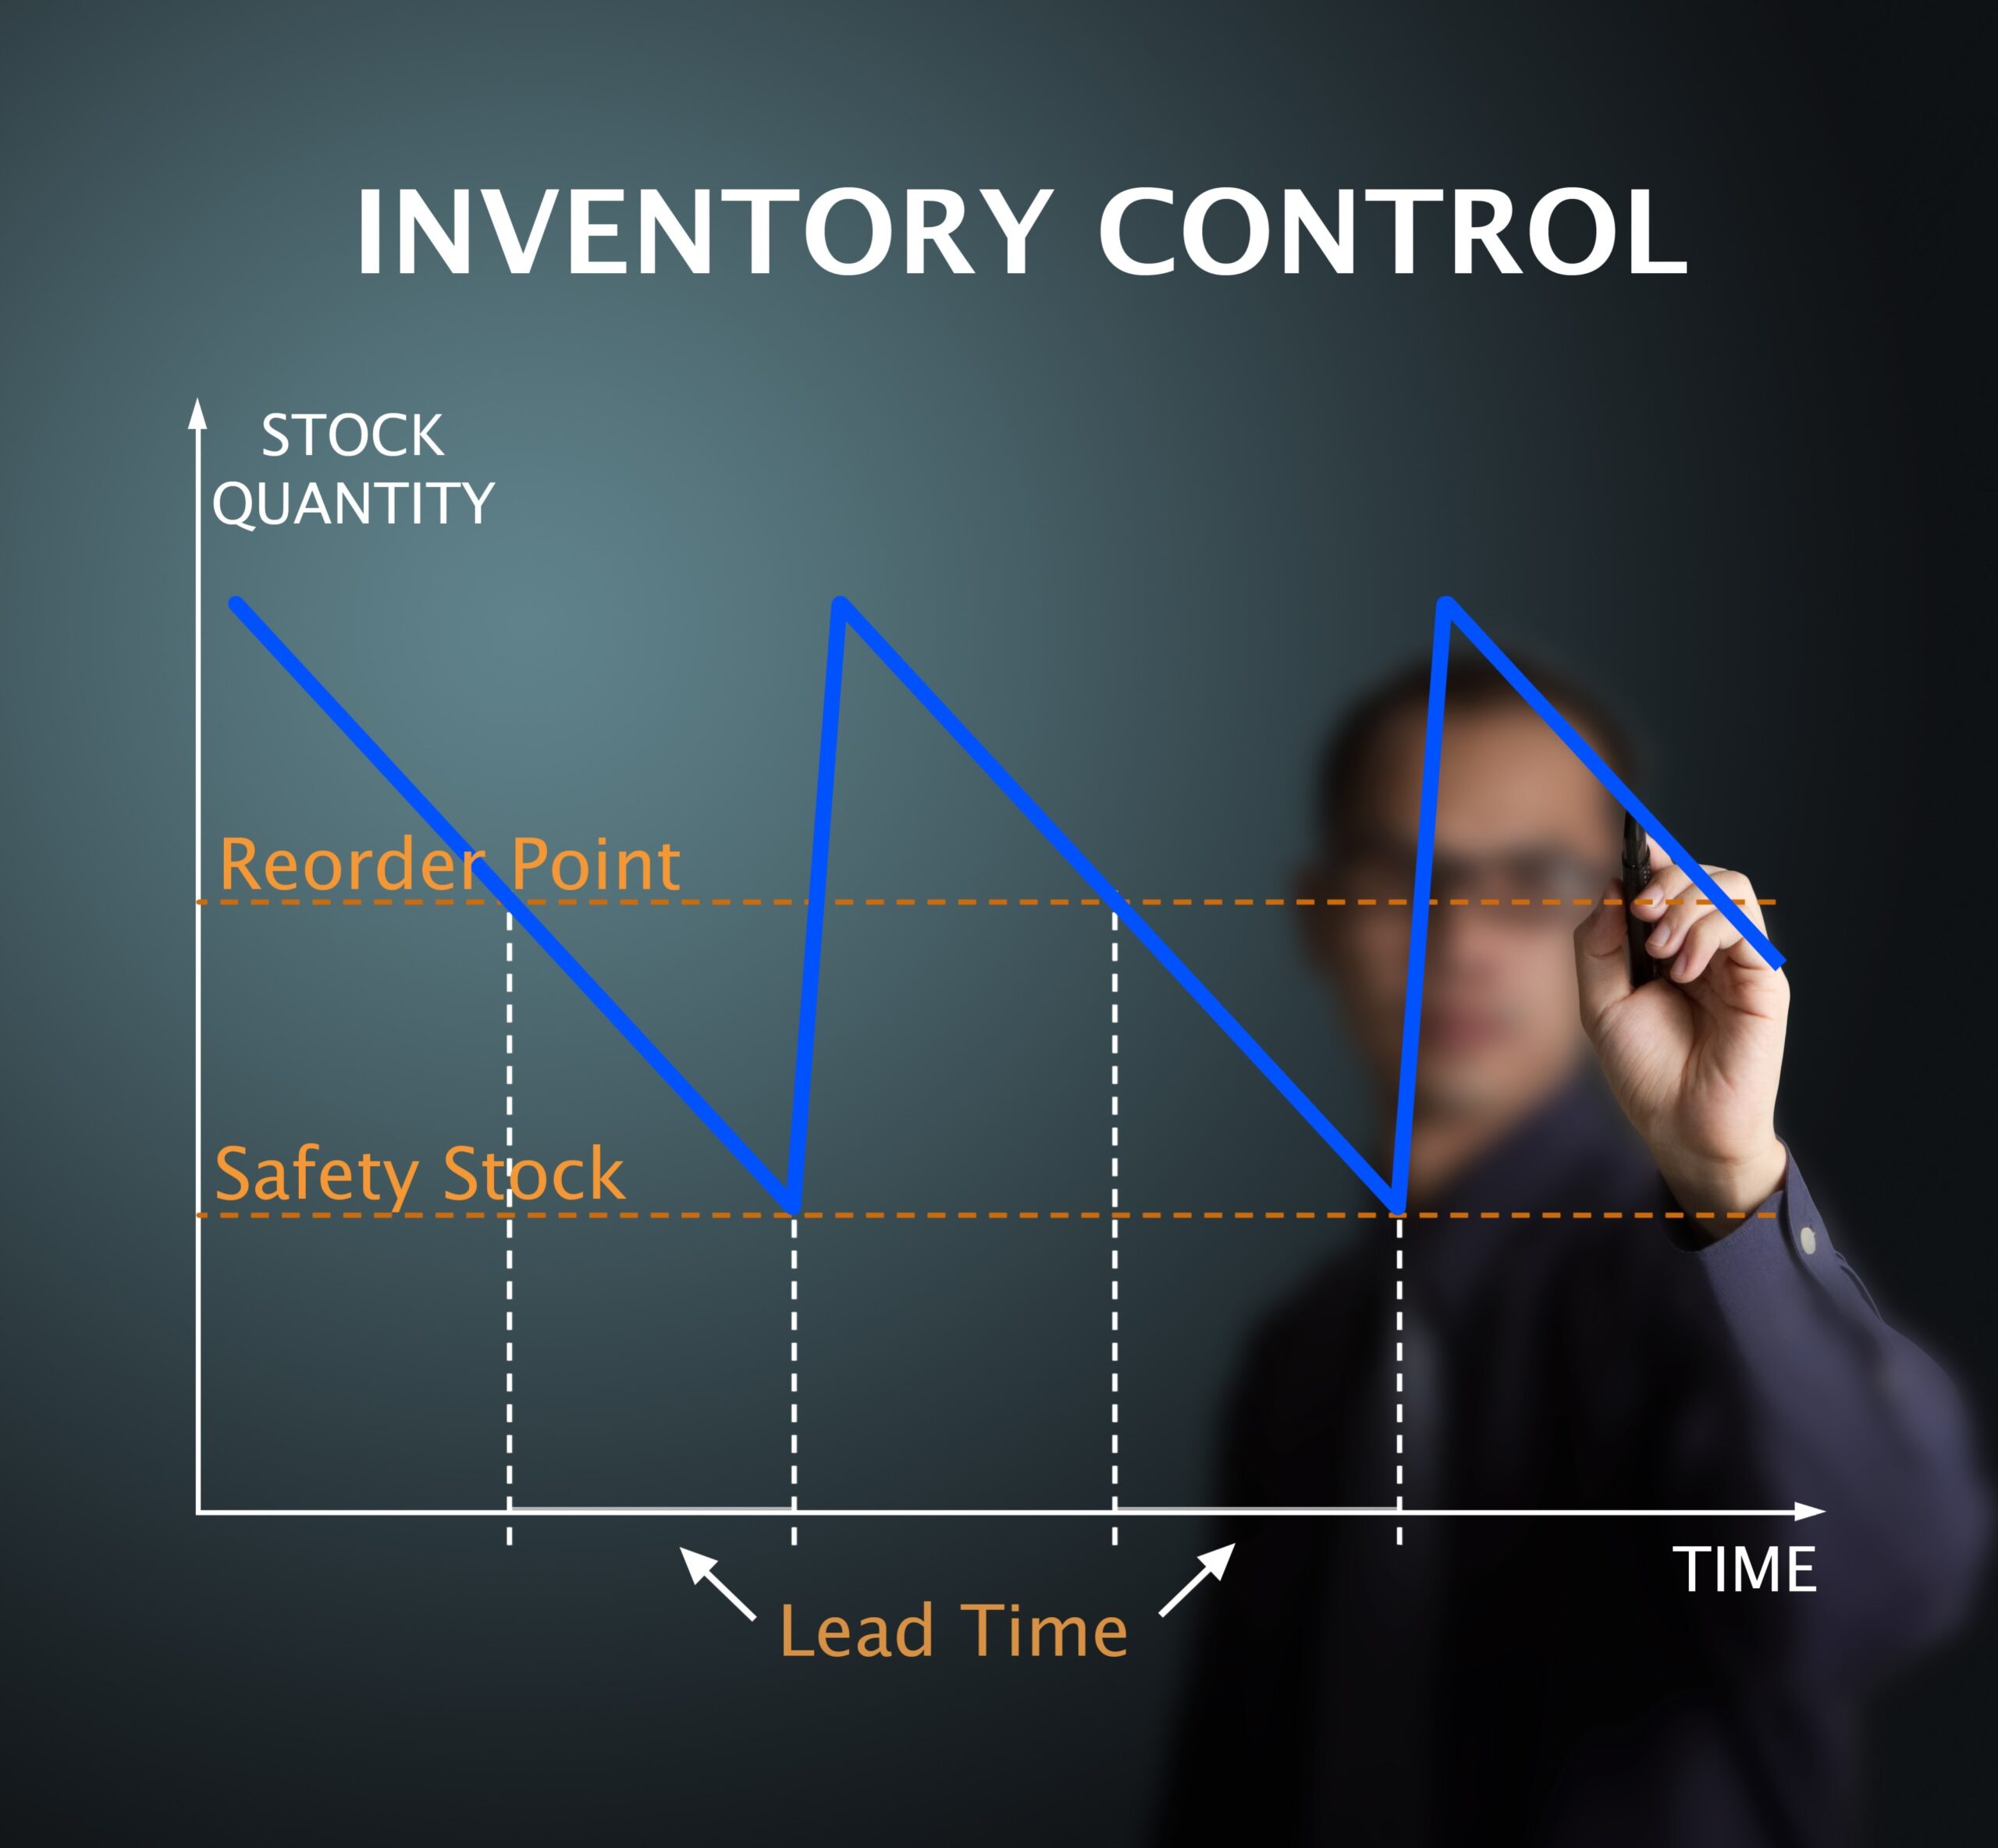
Optimizing Safety Stock (The Buffer Calculation)
Safety stock is the inventory buffer held to prevent a stockout due to unforeseen demand surges or extended lead times. Calculating it accurately is paramount to preventing both under- and overstocking.
The correct calculation balances the desired service level with the inherent volatility of your supply chain.

- Z (Service Factor): The Z-score corresponding to your desired service level (e.g., 95% service level = Z-score of 1.64).
- σD (Standard Deviation of Demand): Measures demand variability.
- σLT (Standard Deviation of Lead Time): Measures supply chain reliability.
By dynamically adjusting the safety stock formula based on real-time changes in lead time reliability, you ensure you are holding precisely the minimum required stock to meet your service goals, directly addressing the problem of excess inventory.
The Dynamic Reorder Point (ROP)
The Reorder Point (ROP) is the stock level that triggers a new order. It must be dynamic, not static.
ROP = (Average Daily Demand * Lead Time in Days) + Safety Stock
This formula ensures that when the order arrives (at the end of the lead time), you still have the required safety stock on hand. Failure to dynamically adjust ROP when lead times increase is a primary driver of stockouts. Manually monitoring this is prone to error, which is why automation is essential.
Calculating Economic Order Quantity (EOQ)
The Economic Order Quantity (EOQ) determines the ideal order size that minimizes the total cost of ordering and holding inventory.
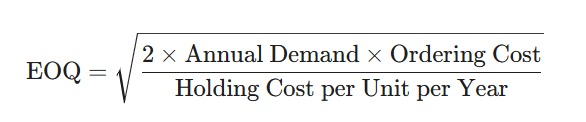
The EOQ model guides purchasing strategy to prevent overstocking by reducing unnecessary order frequency and minimizing associated carrying costs.
Strategic Prevention: Techniques for Modern Supply Chains
Beyond the mathematics, several strategic frameworks are essential for advanced inventory control and optimization.
1. Dynamic SKU Rationalization
You cannot manage what you don’t need. SKU Rationalization involves proactively identifying and eliminating redundant, unprofitable, or slow-moving items. This drastically reduces the complexity of excess inventory management and focuses forecasting efforts on high-value products.
- Actionable Step: Implement a quarterly review where items with zero turns in 12 months are immediately flagged for markdown or liquidation.
2. ABC Inventory Segmentation (Pareto Principle)
Not all inventory is created equal. The ABC Analysis uses the Pareto Principle (80/20 rule) to segment stock keeping units (SKUs) based on their annual dollar volume.
- A Items (Top 20%): High value, tightest control. These demand the most accurate forecasting, dynamic safety stock calculation, and daily review. Focus on preventing stockouts here.
- B Items (Next 30%): Moderate value, automated ROP systems.
- C Items (Bottom 50%): Low value, high volume. Use larger EOQ orders and relaxed safety stock to minimize ordering costs (where overstocking is less financially damaging).
Implementing ABC segmentation ensures your most valuable working capital is allocated correctly, preventing both high-cost stockouts and unnecessary excess inventory.
3. Collaborative Planning, Forecasting, and Replenishment (CPFR)
For organizations with strong supply chain partnerships, CPFR is the gold standard for reducing risk. This process involves sharing planning and forecasting data with key suppliers and distributors.
- Benefit: By sharing your demand forecast, your supplier can adjust their production schedule proactively. This significantly reduces supplier lead time variability the single biggest variable driving the need for large, costly safety stock buffers. CPFR directly prevents sudden stockouts and reduces long-term holding costs.
4. Automated Alerts & Reporting in Aero POS (The Solution)
Applying the complex formulas and dynamic ROP models manually is not feasible for most businesses. This is where advanced POS/Inventory platforms like Aero POS transform strategy into reality.
Aero POS directly addresses the dual crisis through automated systems:
- Preventing Stockouts (ROP Alerts): Aero POS integrates sales velocity and lead time data to constantly monitor the dynamic Reorder Point (ROP). When an SKU hits its calculated ROP, the system generates an immediate Low Stock Alert, ensuring purchasing managers place orders before the safety stock buffer is breached.
- Preventing Overstocking (Inventory Reports): The platform generates a comprehensive Slow-Moving Inventory Report based on your specific ABC segmentation. This report highlights all C- and D-level inventory that hasn’t sold in a user-defined period (e.g., 90 days), triggering the necessary SKU Rationalization actions (markdowns or removal) to free up capital and reduce carrying costs.
Conclusion: Inventory Automation is the Future
The inventory nightmare is solvable through a disciplined, data-driven approach that leverages predictive analytics and classical inventory models (ROP, EOQ, Safety Stock).
To effectively prevent both stockouts and overstocking, businesses must automate the calculation of dynamic ROPs and safety stock levels. Modern inventory management systems, such as Aero POS, utilize machine learning to constantly reassess demand and lead time variability, making real-time adjustments and issuing automated alerts that a human planner cannot match.
Moving forward, the successful enterprise will shift from reacting to shortages and surpluses to maintaining a perpetually optimized, capital-efficient inventory position. Are your systems ready for the future of inventory intelligence?
Next Step: See exactly how the Aero POS Automated Alerts and Reporting feature can transform your manual inventory process into a profitable, data-driven operation.
🙋♂️ Frequently Asked Questions (FAQ)
A stockout results in an immediate lost sale, but its more catastrophic effect is the destruction of customer lifetime value (CLV) and brand loyalty, often leading to customer defection. Overstocking is a silent crisis that ties up vast amounts of working capital, increases inventory carrying costs, and dramatically raises the risk of obsolescence, draining cash flow and inhibiting growth.
Safety stock is a buffer held to prevent a stockout when unforeseen events occur, such as a sudden surge in demand or an extended lead time from a supplier. The goal is to calculate the precise minimum buffer required by balancing the desired service level with the measurable variability of both demand (σD) and lead time (σLT).
EOQ determines the optimal order size that minimizes the total of two opposing costs: the cost of placing an order (ordering costs) and the cost of physically holding inventory (carrying costs). By using EOQ, businesses prevent overstocking by avoiding unnecessarily frequent, small orders and massive, infrequent orders.
ABC Analysis segments your stock keeping units (SKUs) based on their annual dollar volume, following the Pareto Principle (80/20 rule). A-Items (top 20%) require the tightest control, dynamic Reorder Point (ROP) monitoring, and highly accurate forecasting to prevent expensive stockouts. C-Items (bottom 50%) can use larger, less frequent orders to minimize administrative costs, helping to manage complexity and reduce overall overhead.
Aero POS prevents stockouts by automating dynamic ROP monitoring and issuing immediate Low Stock Alerts based on sales velocity and lead time data. It prevents overstocking by generating a comprehensive Slow-Moving Inventory Report, which flags C- and D-level inventory for immediate SKU Rationalization (markdown or removal), freeing up capital.
Recommended Readings: A. The Ultimate Guide to Inventory management B. 5 Ways AeroPOS Simplifies Billing & Inventory C. Automate Billings and Inventory: Aero POS Success Stories from Indian Retailers
Glossary of Inventory Optimization Terms
This glossary defines the key concepts, metrics, and models necessary for mastering your inventory management and achieving optimal balance.
| Term | Definition | Context/Relevance to the Post |
|---|---|---|
| Inventory Optimization | The strategic process of balancing inventory levels to minimize carrying costs while maximizing customer service levels and preventing stockouts. | The primary objective of the entire blog post. |
| Stockout (Out-of-Stock) | A situation where a company is unable to fill a customer’s order due to a lack of available inventory. | Leads to immediate lost sales, customer defection, and damage to CLV. |
| Overstocking | Holding excessive quantities of inventory beyond immediate needs, resulting in high storage, insurance, and obsolescence costs. | The primary cause of tied-up working capital and high inventory carrying costs. |
| Inventory Carrying Costs | All expenses associated with holding and storing inventory over a period. This includes warehousing, labor, insurance, taxes, obsolescence, and the cost of capital tie-up. | The financial burden that overstocking places on a business. |
| SKU (Stock Keeping Unit) | A unique identifier, typically alphanumeric, used to track a specific product or item in inventory. | The unit of analysis for ABC Analysis and demand forecasting. |
| Demand Forecasting | The process of estimating future customer demand for a product or service over a specific period, using historical data and predictive modeling. | The foundational practice required to accurately calculate Safety Stock and ROP. |
| Safety Stock | The extra quantity of inventory held as a buffer to protect against unforeseen fluctuations in demand or extended lead times. | Calculated using variability (standard deviation) to minimize the risk of a stockout while preventing overstocking. |
| Reorder Point (ROP) | The specific inventory level at which a new replenishment order must be placed to avoid running out of stock before the new order arrives. | The operational trigger that must be dynamic (e.g., in Aero POS) to prevent stockouts. |
| Economic Order Quantity (EOQ) | A formula used to calculate the ideal, most cost-effective order quantity that minimizes the total cost of ordering and holding inventory. | A crucial calculation for reducing carrying costs and avoiding inefficient overstocking. |
| Lead Time Variability | The degree to which the time between placing an order with a supplier and receiving the delivery fluctuates. | High variability significantly increases the necessary Safety Stock buffer and is a major risk factor for stockouts. |
| ABC Analysis | An inventory categorization technique that divides SKUs into three classes (A, B, and C) based on their annual consumption value, prioritizing control efforts. | Ensures high-value A-Items receive tighter management to prevent costly stockouts. |
| Customer Lifetime Value (CLV) | A prediction of the net profit attributed to the entire future relationship with a customer. | Directly impacted by stockouts, as losing a customer means losing all potential future revenue. |


I’m Manas Ranjan Sahoo: Developer/Founder of “Webtirety Software”. I’m a Full-time Software Professional and committed to expanding Webtirety Software into a thriving platform that empowers businesses and individuals alike. I love to Write Blogs on Software, Technology, eCommerce, SEO, and Digital Marketing.